Summary
Double-diffusive convection with solid-liquid phase change has many engineering, medical and environmental application, including solidification of casting and ingots, crystal growth process, welding, freeze-drying of food, cryobiology, freezing and melting in oceans and soil. This study is primarily motivated to gain a better understanding of this physical phenomenon and the effect of impact solute concentration on the evaluation of the double – diffusive convection during solidification of a metal analog system – binary mixture of NH4Cl – H2O in a differentially heated cavity. The test cell is a box enclosure. Two vertical plates were made of cooper and cooled/heated by both thermostats. The other walls were adiabatic. The data from the present study may serve as a benchmark data for the validation of numerical simulation techniques for the prediction of the solidification process.
Introduction
The solidification problem, in a differentially heated square Plexiglas cavity (box), of 3.5 % wgt. NH4Cl in water is investigated. On the front and back walls to be situated in row a 7*7 of 1 mm thick of platinum electrodes. All electrodes are connected through a cooper wires with electronically amplifier and so on with acquisition card A/C PCI NI6036E along with NI-CB68LP National Instrument module. Special computer program was designed in order to control all electronically devices.
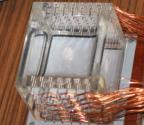
Fig. 1 Pictures of experimental cavity (box), diagram of connected electrodes.
Experimental results
Experimental conductivity fields were obtained during the solidification process are presented below. The relative rate of conductivity was measured in enclosure cavity with 49 electrodes. Blue color is shown front of ice and red one increased area of conductivity (increased concentration of mixture). On the pictures is located colorful scale corresponds to values of electrical conductivity G.
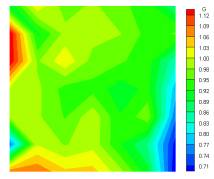
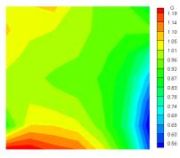
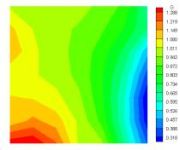
Fig. 2 Relative rate of the conductivity field measured during solidification of 3.5 wt.% aqueous solution of NH4Cl after 3600s, 5400s and 7200s (from left to right) from the start Tc = -10 °C, Th = 9.5 °C.
PIV Results
The results of solidification problem are obtained by PIV method and presented below. White area corresponds with ice front which is forming during the cooling.